UniGroup is a network of logistics companies that operate under a dual brand: United and Mayflower, and share resources and technology amongst each other.
This project involved creating a new financial experience for users of UniGroup’s Converge Move, a central dashboard for viewing customer orders, and solving key business problems by decreasing the error rate in paying out invoices.
For each order at UniGroup, who gets paid what and who pays who is a delicate dance. Teams of billing specialists manually analyze charge breakdowns and negotiate responsibility between franchise members, headquarters, drivers, and contractors.The complexity leads to errors in payment that’s costly for all parties involved, and exposes franchise members to legal risk.
A new product feature to address this would need to confront some key issues:
How to solve the problem? Research is the start. I needed to use research methods to answer the following:
In partnership with product management, I started by gathering information from SMEs and existing literature. Through that, we learned where financial data lived and determined where it would fit best to create an easy transition for users.
We landed on this data being integrated into our general order information dashboard, Converge Move, which was going to be a big change from where data currently lived.


We also discovered that the payments process isn't one that happens at the end of an order, it happens fluidly throughout the lifecycle of an order and even has it’s own stages with different relevant data:

After understanding the process on a surface level, I formulated interview questions based on the different stages to understand what the user’s needs were and how those needs evolved across the lifecycle of a customer’s order.
After each user interview, I captured notes in Figjam. Then, I created an affinity map of all notes to represent all of the users pain points and analyze the patterns.


Takeaways from Affinity Mapping:
Given the research takeaways and negotiated scope, we defined the following design requirements:
Once the requirements were established, I moved on to wire-framing the new experience in Figjam. Using the documentation gathered in the research phase, I created quick sketches of two views to incorporate the requirements above.

Low fidelity testing with users early in the process revealed a few additional details that weren’t caught in the initial research phase: Users needed a way to sort and filter what charges were specific to them out of the overall list of charges, based on their role on the order. New wireframes were created with this requirement in mind.

I continued iterating and testing with users.

After a few iterations with users and confirmation with product and engineering, I felt confident moving to a high-fidelity prototype. In the end, we were able to deliver a solution to users that satisfied the requirements:
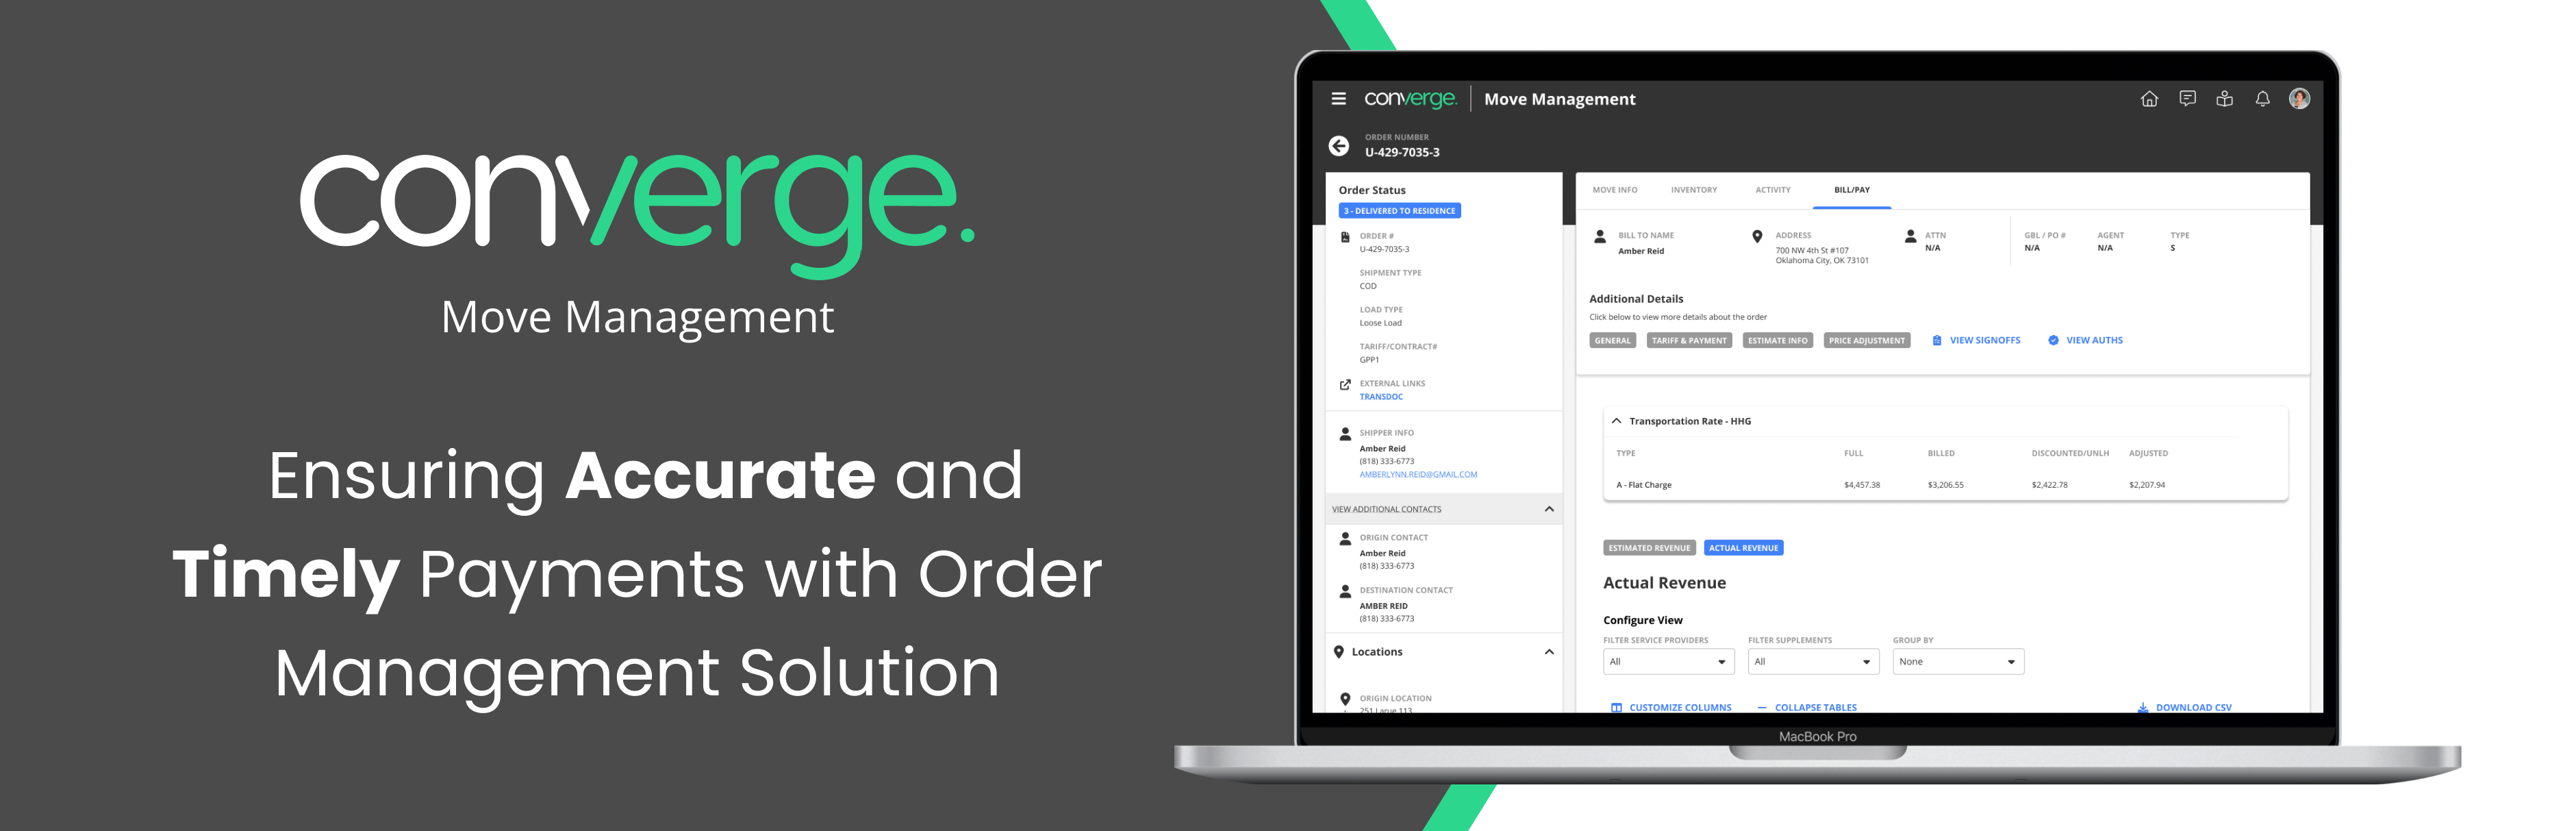
The estimated revenue view compiles values from different legacy tech sources to display everything in one simple table. Users can toggle between the estimated revenue view and the actual revenue - making it very easy to compare values.

The actual revenue view paints a more complete picture of what charges were made, and what party is going to get the payout, allowing users a clear view of what actuals to expect for each order.

Users can group the table by company, charge, or category of charges. This creates multiple tables that the user can view totals in, and configure however they like. They can also filter the grouped view down further by company, allowing each involved party to see their own revenue in a simple and easy way.

Users are able to click on any line item in the table to view a breakdown of the charge. This is different for every line item, as different factors impact each price. In this example, the linehaul charges are affected by weight and miles, so I've included this data in the breakdown.

The consolidated bill view allows users to view all of the customer bills at once, and filter by relevant ones. This reduces confusion on which amounts on the bill are the most accurate, and further allows users to compare these totals to the revenue that was made on the order.

Before launch, I gathered another round of feedback on the prototypes to make sure there was nothing I missed. The standout feedback was that the CSV download that would allow them to download each table was an huge benefit to their workflows, which already required them to be working in excel.
Users also had high praise for the group-by feature and filters, one user stating that being able to sort things out will help them understand the totals much easier.
I can already see where this would save me a lot of time. - Matt K.
This project really reinforced to me the importance of iteration. Given the complexity and significance of this stage in the order’s lifecycle, it was crucial to get it right. One of the biggest challenges I faced was designing for all user groups rather than focusing on just one persona. By testing early wireframes, I was able to quickly identify gaps in functionality, and addressing these gaps lead to the group-by feature and enhanced filtering, which ensured a more inclusive, seamless experience. Seeing how these refinements improved efficiency and reduced errors reinforced my belief in early testing and continuous iteration! Ultimately, I’m proud that we created a tool that not only streamlined workflows but also had a meaningful impact on our users’ daily tasks.